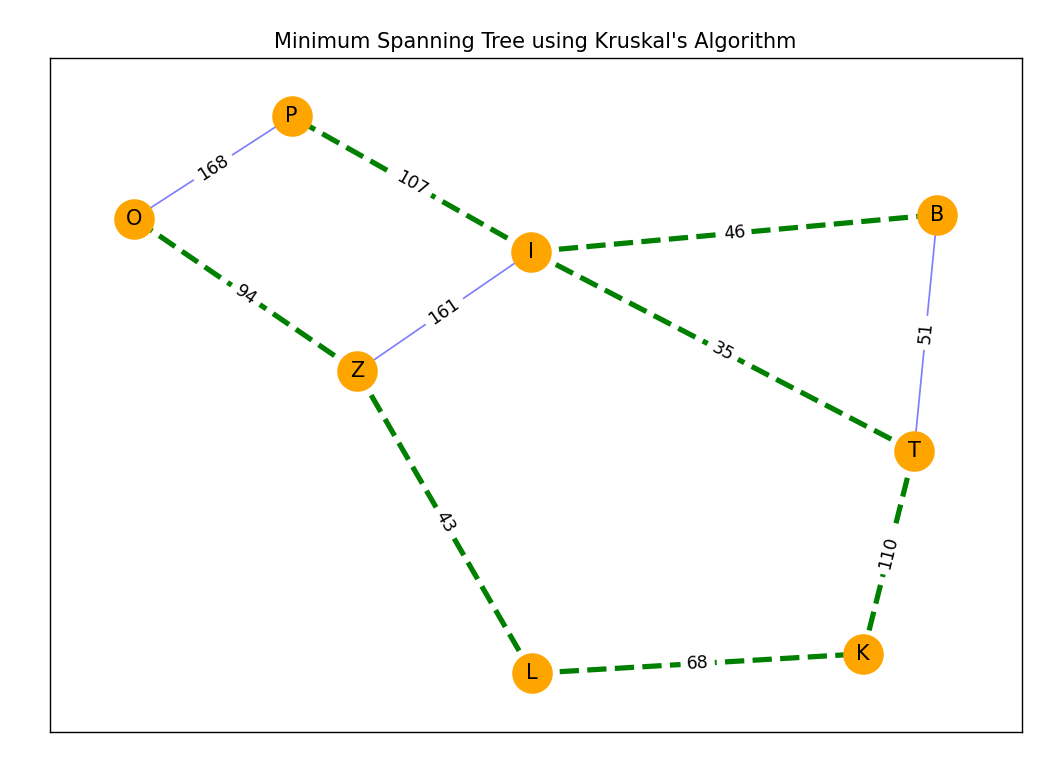
Możliwe, że to kwestia prompta albo po prostu miał zły dzień ;-) Dla powyższych danych wygnerował mi kod w pythonie, który wygenerował następujący graf:
(kodu nie sprawdzałem)
import matplotlib.pyplot as plt
import networkx as nx
# Define the edges of the graph
edges = [
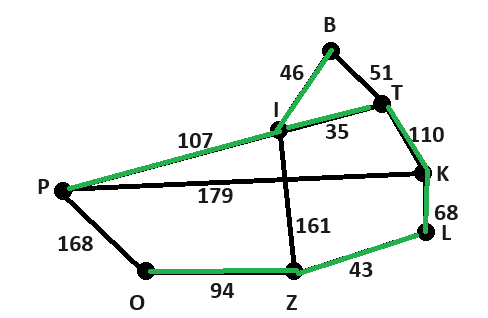
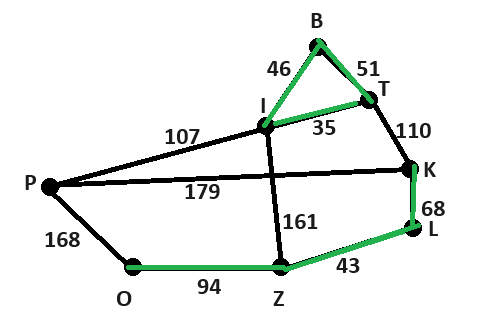
('I', 'T', 35),
('Z', 'L', 43),
('I', 'B', 46),
('B', 'T', 51),
('K', 'L', 68),
('O', 'Z', 94),
('P', 'I', 107),
('T', 'K', 110),
('I', 'Z', 161),
('P', 'O', 168)
]
# Create a graph and add the edges
G = nx.Graph()
G.add_weighted_edges_from(edges)
# Function to find the MST using Kruskal's algorithm
def kruskal_mst(graph):
# Sort edges by weight
sorted_edges = sorted(graph.edges(data=True), key=lambda x: x[2]['weight'])
# Create a union-find data structure
uf = nx.utils.UnionFind()
mst = [] # List to store the edges of the MST
for u, v, data in sorted_edges:
if uf[u] != uf[v]:
uf.union(u, v)
mst.append((u, v, data['weight']))
return mst
# Get the MST using Kruskal's algorithm
mst_edges = kruskal_mst(G)
# Separate MST edges and non-MST edges
mst_edge_list = [(u, v) for u, v, w in mst_edges]
non_mst_edges = [edge for edge in edges if (edge[0], edge[1]) not in mst_edge_list and (edge[1], edge[0]) not in mst_edge_list]
# Visualize the graph
pos = nx.spring_layout(G) # Position the nodes
plt.figure(figsize=(10, 7))
# Draw all non-MST edges in blue
nx.draw_networkx_edges(G, pos, edgelist=non_mst_edges, edge_color='blue', alpha=0.5)
# Draw MST edges in green, dashed, and thicker
nx.draw_networkx_edges(G, pos, edgelist=mst_edge_list, edge_color='green', style='dashed', width=3)
# Draw nodes and labels
nx.draw_networkx_nodes(G, pos, node_size=500, node_color='orange')
nx.draw_networkx_labels(G, pos)
edge_labels = {(u, v): d['weight'] for u, v, d in G.edges(data=True)}
nx.draw_networkx_edge_labels(G, pos, edge_labels=edge_labels)
# Display the plot
plt.title('Minimum Spanning Tree using Kruskal\'s Algorithm')
plt.savefig('mst_kruskal_dashed.jpg')
plt.show()